
Lean PlanDo manual › Insights
Lean PlanDo Insights
See what Lean PlanDo Insights shows about your project's performance and how to open it.
Use Insights to see up-to-date performance for your whole project and make informed decisions. Insights uses live execution data from the Lean PlanDo web and mobile apps.
Insights shows this data as charts and graphs, so you can:
- understand the current status and progress of the project
- analyse the causes of delay
- carry out plans to avoid further delays
- improve overall plan reliability
Open Insights
Insights is a separate site, insights.app.leanplando.com, with two tabs: Overview and Weekly.
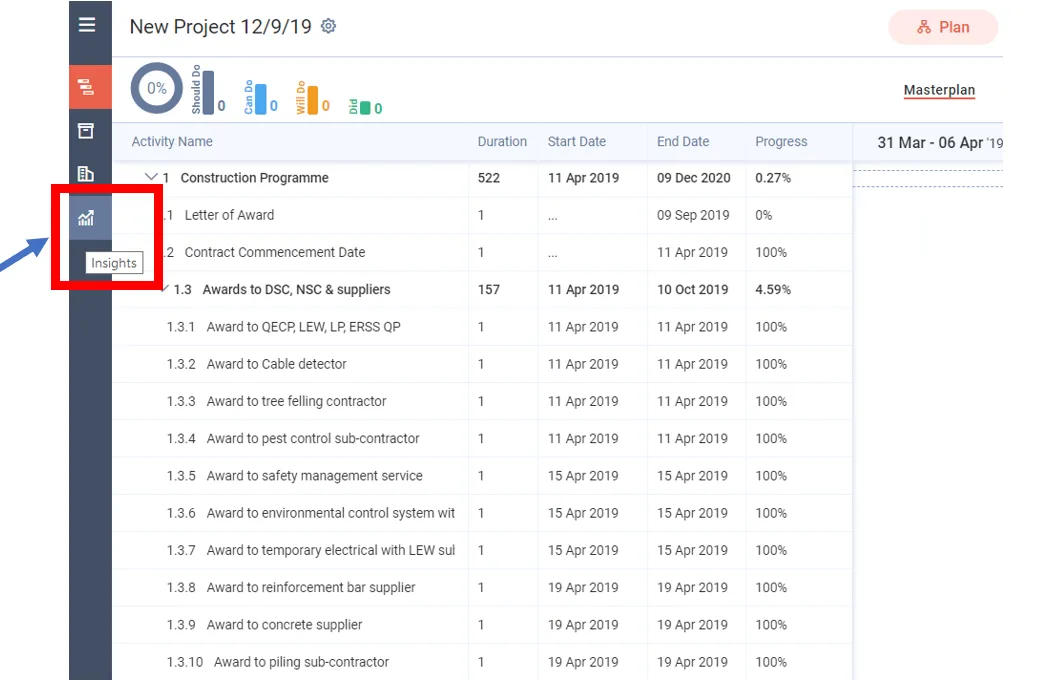
Click the Insights icon on the left panel of a project. Insights opens in a new browser tab. You see the icon only on schedule or Flow-schedule projects, and only if you have permission to view Insights.
What Insights shows
- Project status
- Weekly project progress (time): see Project progress
- Weekly project progress, early and late (actual progress against early-start and late-start progress)
- On Flow-schedule projects: project delays by workflows
- Project delays: see Critical project delays
- Weekly workable backlog: see Workable backlogs
- Weekly commitments and reliability: see Commitment and reliability
- Plan reliability in start dates, end dates and duration: see Plan reliability
- Delay classification
- Delay responsibility
- Work delays
- Constraint Delays (a constraint is work that must be cleared before a task can be done, such as getting site access)
- Top Delayed Activities, Top Extended Activities, Top Shortened Activities and Top Early Finished Activities
The Overview tab uses data from the start of the project. It shows overall performance, plan reliability and productivity, and metrics such as the top delayed activities. It also shows the top reasons the project was delayed. This helps the management team see the major challenges in the project at a high level.
The Weekly tab shows one week at a time: a project summary, the week highlights, CPR, delay classification, work delays and constraint delays.
Last updated 2023-07-10. Part of Insights in the Lean PlanDo manual. Lean PlanDo by Lean Station.