
Lean PlanDo manual › Insights
Project progress
Read the Weekly Project Progress (Time) S-curve to compare planned, actual and expected progress.
Use the Weekly Project Progress (Time) chart on the Overview tab to compare planned, actual and expected progress in terms of time. It is shown as an S-curve.
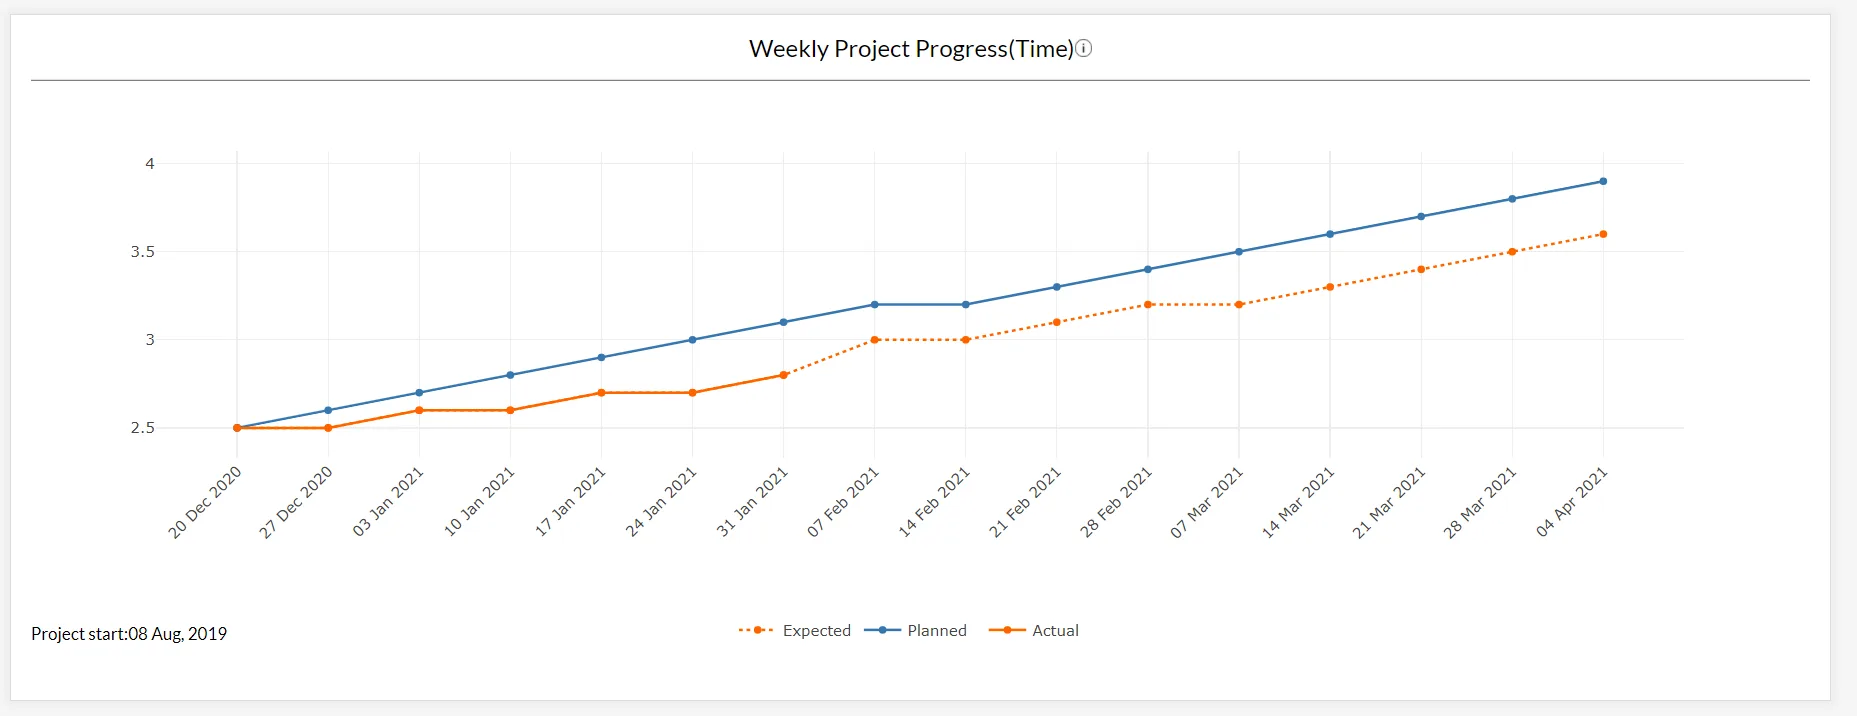
The chart shows the actual and expected progress of the project against the planned progress:
- Planned progress comes from the baseline schedule of the activities.
- Actual progress comes from the progress you enter on tasks.
- Expected progress comes from the planned or expected schedule of the activities. It is recalculated each time the expected dates of an activity change.
For details of each calculation, see How progress is calculated.
Weekly Project Progress (Early & Late)
The Overview tab also has the Weekly Project Progress (Early & Late) chart. It compares actual progress with the progress the project would make if every activity ran on its early start dates or on its late start dates. It plots three weekly lines:
- Early Start Progress and Late Start Progress: planned progress if every activity runs on its early or late start dates. They are weighted by duration, like planned progress.
- Actual Progress: shown only for weeks before the current Lookahead.
The early and late lines are worked out once, when the first Lookahead is generated, or from early and late dates uploaded in a file.
Last updated 2021-02-08. Part of Insights in the Lean PlanDo manual. Lean PlanDo by Lean Station.